DETROIT — A new report asks whether average U.S. workers are really able to afford their commute, given historically high inflation, gas prices and most importantly, the cost of maintaining vehicles.
The report by the website Clever, a real estate market and consumer research group, ranked the best and worst metros for driving based on the costs to drivers for keeping and maintaining a vehicle, and the time spent in traffic annually.
Drivers in Metro Detroit will perhaps not be surprised that it ranks the lowest of the 50 metro areas Clever’s researchers looked at.
The report looked at various criteria in making its determinations.

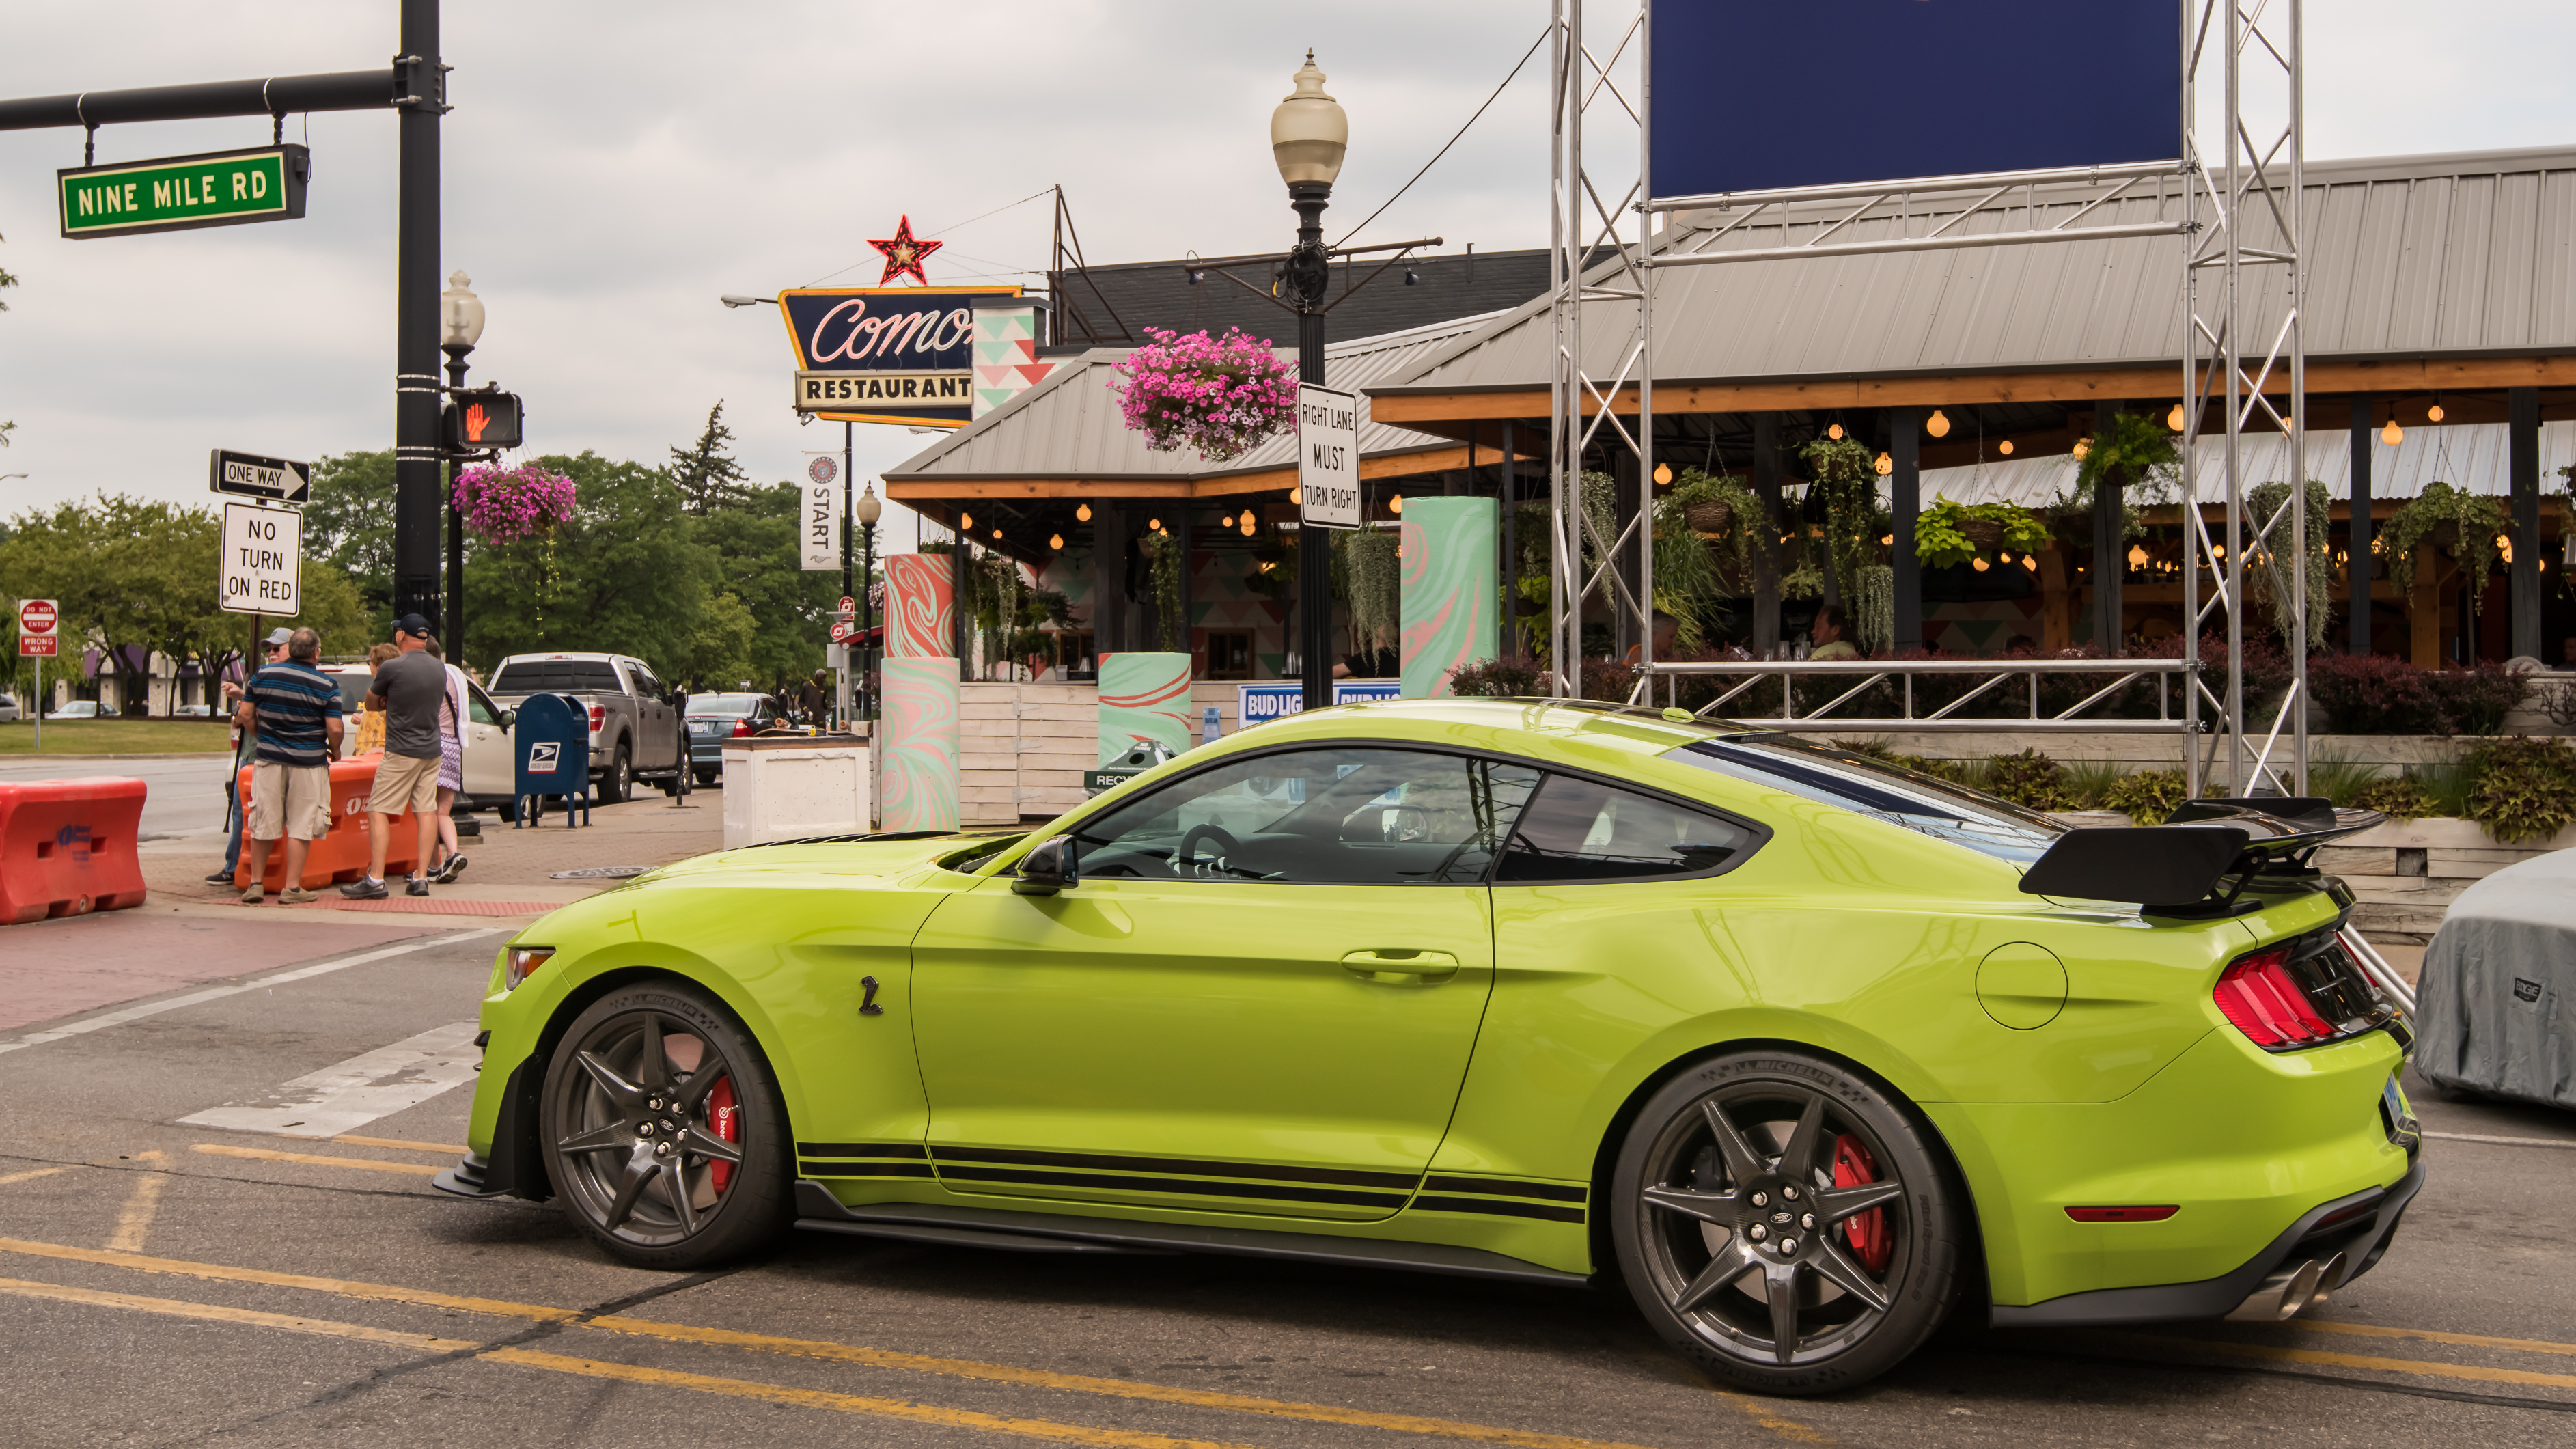
A 2020 Ford Mustang Shelby GT500 in Ferndale, Michigan. Photo: Steve Lagreca/Shutterstock
Metro Detroit drivers spend about $989 on fuel and $487 on car maintenance each year. They also lose an average of $5,045 a year in potential income that is lost due to time spent commuting to work.
These included average time commuters spend on commuting every year, the money an average commuter spends on fuel, maintenance, insurance, how much potential income is lost to time spent commuting to work and more.
The report says that people in Metro Detroit spend on average of 29 percent of their annual income on commuting, amounting to $12,801 a year. This is up a shocking 59 percent from 2019.
By comparison, drivers in Buffalo, the cheapest city for commuting, spend an average of 15 percent of their income, or only $6,427 annually.
Metro Detroit drivers spend about $989 on fuel and $487 on car maintenance each year. They also lose an average of $5,045 a year in potential income that is lost due to time spent commuting to work.
Detroit’s low ranking comes from annual car insurance costs and the high cost of commuting in general. The average Detroit resident spends a whopping $6,280 on car insurance every year and commuters spend 29 percent of their annual income traveling to and from work. In recent years, Detroit and neighboring Dearborn have been rated the highest for car insurance costs in the country.
But the report also says Detroit isn’t nearly as congested as other metros. Residents lose 59 percent less time to traffic every year, spending just 13 hours in traffic annually versus 32 percent in the average city.
Graphic courtesy of Clever
People in Detroit, San Francisco and New York spend the most money per year on their commutes according to the report, averaging 47 percent more than the typical annual commute cost in the average U.S. city.
Driving isn’t easy for most workers in the U.S., however. The average worker commutes a total of 28 minutes one-way to work. In the average U.S. metro, workers spend an average of 239 hours every year commuting – amounting to 3 percent of their year in total.
The report acknowledges that gas prices are the highest they’ve ever been, inflation has seen the largest year-over-year spike since 1981 in the country and used vehicle prices leaped 41 percent since 2021.
Clever’s data comes from the U.S. Bureau of Labor Statistics, the U.S. Department of Transportation Federal Highway Administration, the U.S. Census, the American Automobile Association, the Brookings Institute, INRIX, GasBuddy and The Zebra.


Leave a Reply