DEARBORN — Though breaking down precinct voting data by the Arab American category has always been a challenge, data from several sources for the Nov. 3 election show how Arab American voters turned up in great numbers for President-elect Joe Biden.
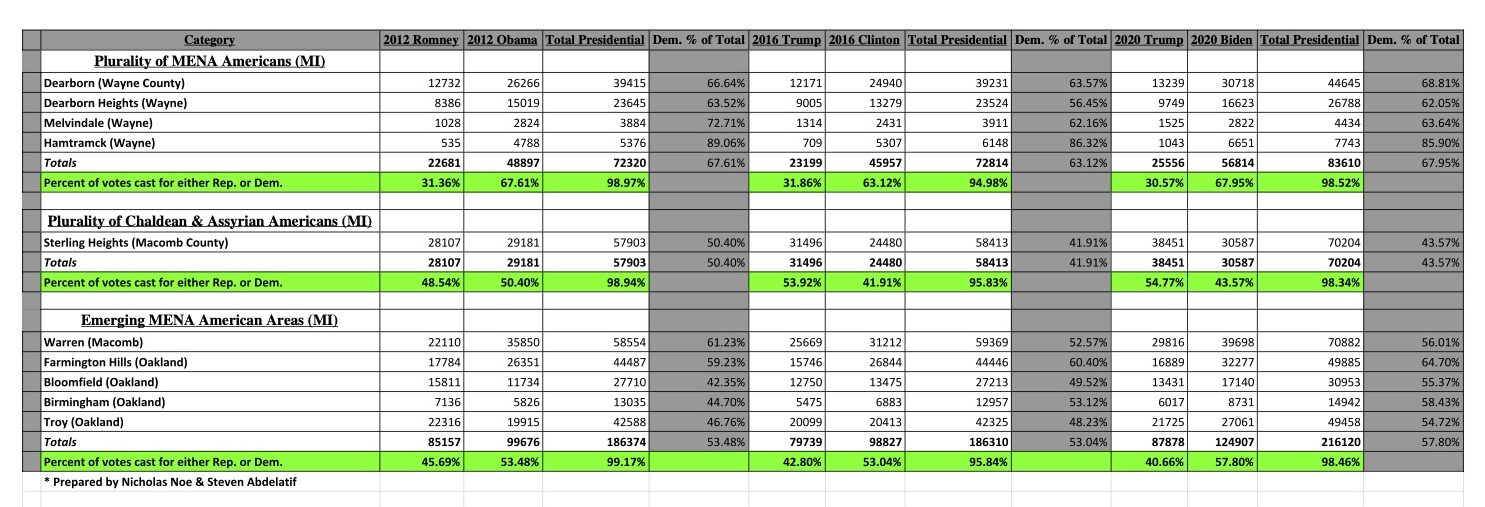
Data analysis sent over by Mideast Wire shows the overall preference for Biden over President Trump, and even over Democratic candidate Hillary Clinton in 2016:
- In the four municipalities that have the highest concentration of Arab Americans (Dearborn, Dearborn Heights, Melvindale and Hamtramck), 68 percent of voters supported Biden versus 30.6 percent who supported Trump. In these areas, voters returned to voting for a Democratic president after having reduced their support in 2016 for Clinton by almost 3,000 votes compared to the 2012 election.
- More than 43,000 additional voters came out for Biden in 2020 in heavily Arab American areas compared to 2016, which significantly factored into Biden’s 150,000 vote margin in the state overall.
- Although Trump grew his voting base in 2020 by almost 3,000 votes compared to Republican candidate Mitt Romney in 2012, his overall share of the votes cast remained virtually the same as Romney’s, as Biden was able to grow his own base by more than 8,000 votes compared to Barack Obama in 2012.
- Tallies in East Dearborn show 13,286 (80.85 percent) supported Biden over Trump (2,780 or 16.9 percent). Biden received 1,174 votes to Trump’s 142 in the predominantly Yemeni American Southend of Dearborn.
- Biden was able to recover support for his Democratic candidacy from Clinton in 2016 in Sterling Heights, an area with a large population of Chaldean and Assyrian Americans who are from Iraq, an Arab country. There he received 6,000 more than votes than Clinton and captured 43.6 percent of all presidential ballots cast compared to 42 percent for Clinton (which itself was a marked drop off from the 50.4 percent that Obama gained in the area in 2012).
- But Sterling Heights remains a majority Republican municipality. Trump received 7,000 more votes there in 2016.

The data was drawn from “Language Access Analysis” produced by Data Driven Detroit and Global Detroit, the American Community Survey’s Public Use Microdata Sets and other periodic surveys conducted over the last decade. Members from The Arab American National Museum and ACCESS assisted with gathering and analysis of the data presented here.


Leave a Reply